This feature article was co-authored with Felix Perrone
In three events across a similarly expansive swath of the country as last week, we played 15 ranked matches and three JV contests. This has brought the records to a nice and round 1300 ranked matches. We saw a feature article with Dylan and Felix, in this feature article, Felix and I will present some more fun facts regarding that large chunk of data. Complete records span eight seasons, from the Opening Match on 2010-09-25 to this weekends games of 2017-10-08. While we have a number of matches recorded from 2005-2010, those records are not complete and as reliable so we refer to those as the dark times.
We had three events this weekend at PSU, GSU, and GVSU.
So far:
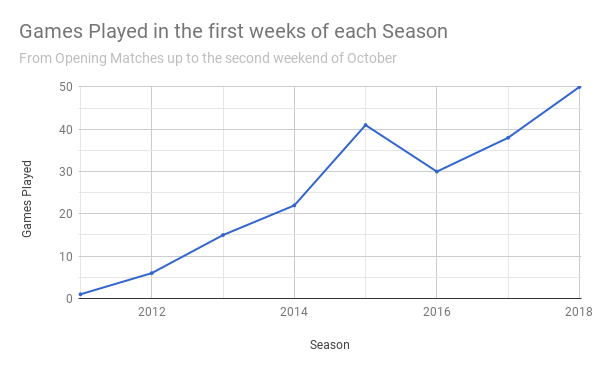
- 50 matches played in the 2018 Season (another round number!)
- 23 teams of our 32 active teams have played (not as round)
- just 1 overtime (way under average)
- 11 technical upsets (about on target)
- a historical leader dips (more on that later)
Technical Upsets this Weekend
There were just three technical upsets in the three events held this past weekend. With 11 technical upsets in 50 matches, were about on target considering our historical prediction success rate. We have 247 technical upsets in 1300 ranked matches (81%). This weekend’s upsets presented in order of statistical weight:
Kent def SVSU 3-2
It’s games like these where I would really like to see when each point was scored, but it seems that even Cody Putnam can’t provide stats for his own team despite his badgering to other captains. That’s ok, we can talk about the significance of this match result in the history of both teams. This match ranks #66 out of 247 technical upsets, falling in the 73rd percentile. SV lost an above average chunk on their rating exchange with Kent.
In Bailey’s Gauntlet preview I mentioned this was a reachable upset, and this is a prime example of an upset we should pay attention to; good weight between similar tier competitors, though not necessarily 1 in 100 rare. SVSU has encountered some of these losses before, by nature of its neighboring competitors. SVSU has more opportunities to get upset wins in a region where they are middle ranked team, going 20 and 12 in technical upsets. Kent however doesn’t have as many technical upset wins to the program’s name. Perhaps because of their historical strength, Kent has lost more in technical upsets than has won (15 upset wins and 22 upset losses).
There’s plenty of room left in the season and teams are only a handful of matches in. I’m sure SV is a tad undervalued but they are still a rating leader in the League. However, this upset has proven that Kent is also a rating leader, a position in which they have generally held on average.
UNG def GSU 7-0
The Gonzalez system can’t take much stock in point differential, as that’s a dangerous game to slide into. But the first match of their double header counted as a technical upset in the system, ever so slightly. It ranks 161 of 247 technical upsets, falling only in the 34th percentile. Worth noting is that since this match was so close, the system favored UNG in the next match after the first rating exchange was tabulated. These kinds of upsets can be considered rating adjustments, especially with new teams that don’t have a larger number of games in their history. These kinds of upsets are healthy. GSU was rated a tad highly, and UNG was rated a tad too low. We can be more confident that UNG and GSU’s resulting ratings are more accurate, after the results of this double header.
CMU def GVSU 4-1
The least influential upset of the day was still the third largest exchange, as upsets in regulation are always worth more. I would like to present the story that this wasn’t necessarily a loss for GV’s top rated spot (more on that later), but that CMU has developed into an actual competitor for Grand Valley. It is rare that GVSU encounters an upset loss, but they have occurred. GV is 10 and 17 in upsets for similar reasons that Kent was. GV has competed in the top tier for the entire recorded history.
CMU entered the season at #2 with a 50.702. They’ve posted a 9-0 record with a current 54.835 rating and it’s very reasonable to see the trend continuing. While GV started the season at 54.701, they currently sit at 52.666. A rating gap of 2.175 isn’t far when you’re at the top tier. Though, we could actually be witnessing the beginning of a longer slide for Grand Valley, which is unprecedented but still possible. I am excited to see this series develop as the season progresses.
Standings after 50 games
| Mov. | Rank | Rating | Team |
|---|---|---|---|
| ↑ from 2 | 1 | 54.835 | CMU |
| ↓ from 1 | 2 | 52.666 | GVSU |
| ↑ from 4 | 3 | 48.618 | JMU |
| ↑ from 8 | 4 | 47.117 | Kent |
| ↓ from 3 | 5 | 46.747 | SVSU |
| ↓ from 5 | 6 | 46.196 | UK |
| ↓ from 6 | 7 | 45.996 | Towson |
| ↓ from 7 | 8 | 44.523 | MSU |
| — | 9 | 43.626 | UWP |
| — | 10 | 43.171 | BGSU |
| — | 11 | 42.524 | OSU |
| — | 12 | 42.386 | VCU |
| — | 13 | 40.974 | PSU |
| — | 14 | 40.934 | DePaul |
| — | 15 | 40.502 | UNT |
| — | 16 | 40.139 | WKU |
| — | 17 | 39.642 | UVA |
| ↑ from 25 | 18 | 39.165 | UNG |
| ↓ from 18 | 19 | 39.021 | Ohio |
| — | 20 | 38.586 | UWW |
| — | 21 | 38.557 | NIU |
| — | 22 | 37.885 | MC |
| ↓ from 19 | 23 | 37.866 | UMD |
| ↓ from 23 | 24 | 37.722 | Pitt |
| ↑ from 26 | 25 | 36.702 | UNL |
| ↑ from 27 | 26 | 36.381 | BW |
| ↑ from 28 | 27 | 36.169 | NSU |
| ↑ from 29 | 28 | 35.966 | Akron |
| ↑ from 30 | 29 | 35.834 | CSU |
| ↓ from 24 | 30 | 35.442 | GSU |
| — | 31 | 34.659 | SU |
| — | 32 | 33.498 | Miami |
Movement as of 2017-10-03.
CMU is now #1. That’s big (more on that later). It’s still a two team show at the top, and it appears that GV has yielded for the moment. This really is an extension to Central’s trend of winning games. CMU was heading for the top and GV failed to hold off the losses that would bump them from the top rating.
MSU is down. The next teams from the top are jostling competitively for the positions, but they are still a ways from #2 or #1. Even so, Michigan State is in a weird zone at the bottom of this tier. Historically they would be able to compete with the second tier, but this season’s results see them tippling downward in a similar way as UMD. We’ve seen a matchup against BGSU, and we would really love to see a matchup with UWP. An old school OSU/MSU match would be very telling for both programs, since OSU hasn’t even played a match so far.
PSU is cruising. Despite a net loss this weekend, Penn State sits at the mean rating point of the League. That’s a great position to be in if you want to get good value for the games you play. But if you can’t travel, host. It’s a shame that we don’t find more Ohio and Michigan teams utilizing PSU as a middleman venue. There is fun to be had in University Park, I’m sure.
UNG advances with just two wins. North Georgia’s double header victory is a classic example of how playing an opponent with a similar rating is good for you (if you win of course). They jumped from 25 to #18, further helped by the tightly packed ratings of that section.
The lower third prepares. Akron really knows how to host em. They are bringing a ton of teams to the annual Pink Out tournament. We’ll see a slew of games (17 scheduled) across three courts and its results will touch every section of the Standings chart (save the top tier). Better yet, I see a realistic JV match scheduled, and I hope this turns out a positive experience for Ohio and BG’s second teams. We’re ready to stash the result in the records.
We only have 1 overtime on record. This is a tad unusual, as overall we’ve had 104 overtimes in 1300 matches (8%). We should have seen around 4 overtimes if we were looking at the current average. This average was slightly higher at the start of the season too, at about 1 in 10. There has been a measurable effect. I can speculate on a number of potential reasons, but none would do us too good. We just haven’t had a lot of overtimes to evaluate the data and be confident in the analysis. Is the new ruleset affecting close nail biters? Maybe. Have we just not seen enough close matches to push into OT? Possibly. Is Overtime occurrence a complex set of variables we haven’t been able to quantify yet? You bet.
Grouping Teams by Rating
We’ve referred to tiers before, and please be aware that kind of talk is very arbitrary as they don’t really affect anything. It is similar to Regions as we use the term discuss groups of teams, in this case grouping teams by similar rating. For this iteration, inspired by Director Hunter Ford, we got a little scientific for fun.
First, the mean predicted exchange for all technical upsets was calculated and a standard deviation was applied. The mean rating gap for an upset falls at 2.692 points between either team’s rating, which is fairly close. A predicted exchange for these upsets would fall around .731.
Second, we took that mean rating gap for upsets and arithmetic’d it to the all the ratings on the list to give a high and low threshold. In the top tiers, a team might have two or three ratings above or below their own in which an average upset would fall. Saginaw is an anchor of the second tier, grouping JMU and Kent on the top end but guarding against UK, Towson, and MSU on the lower end of the threshold. In a lower tier, UMD anchors 15 teams in the same threshold (+/- 2.692 of a given team’s rating). Quite a bit considering we only have 32 ratings listed.
- CMU, GVSU
- JMU, Kent, SVSU, UK, Towson
- MSU, UWP, BGSU, OSU, VCU
- PSU, DePaul, UNT, WKU, UVA, UNG, Ohio
- UWW, NIU, MC, UMD, Pitt, UNL, BW
- NSU, Akron, CSU, GSU, SU, Miami
Mileage May Vary
Since this makes an educated guess by using past upset data to compare potential opponents of a similar rating, I wouldn’t recommend using this in any other way than a talking point. It is an extremely imperfect attempt to group teams, and really falls apart after the #12 position. After this point, team ratings are much closer signaling closer potential games. Close games are tougher to predict, makes it tougher to delineate common opponents.
On another level, this lower half of the standings includes teams that haven’t played much and might not have the most accurate rating especially so early in the season. Always remember this system is meant to come into its own for Nationals, and we really do use rating differential as a factor in making the schedule. We count on teams playing an adequate amount of games during the season to ensure a nice base rating to schedule matches from. It’s even the new policy this year, teams must play three matches to qualify for Nationals (I’m looking at you, OSU).
Rating Changes from the Weekend
| Team | Pre | Post | Change |
|---|---|---|---|
| Kent | 44.839 | 47.117 | 2.278 |
| UNG | 37.119 | 39.165 | 2.047 |
| CMU | 53.207 | 54.835 | 1.628 |
| JMU | 47.240 | 48.618 | 1.378 |
| Towson | 45.774 | 45.996 | 0.222 |
| PSU | 41.615 | 40.974 | -0.641 |
| GVSU | 53.321 | 52.666 | -0.655 |
| UMD | 38.825 | 37.866 | -0.959 |
| MSU | 45.698 | 44.523 | -1.175 |
| GSU | 37.489 | 35.442 | -2.047 |
| SVSU | 48.823 | 46.747 | -2.076 |
Kent is the biggest victor of the weekend, netting +2.278 over three matches. They had a minor stake against a top ranked GV game, then pulled an upset against tier leading SVSU, and grabbed a close win against MSU. These actions maximized their point gains in a way few teams would be able to accomplish; especially after dipping games on their home court the week earlier. CMU and UNG are not far behind after winning their sets. JMU also posted a winning record on their set in University Park, but were slightly hampered by the quality of their opponents. Netting +1.378 is a strong grab, it just wasn’t the same as CMU and Kent’s quality opponents.
On the opposite spectrum, SVSU dropped the most from their 0-3 posting, just slightly behind GSU which dropped a similar amount. GVSU’s negative rating posting is one of the largest they’ve seen, which is another indicator to how rare losing tends to be a GVSU operation. To round out this note, UMD dropped almost a full point in a closely packed tier, so their position drop is more perilous than MSU. A win or loss by the Spartans will better group them into a tier, at least for a moment.
We’ll need to see these teams play more to determine the end of the shakeout. More dodgeball over less dodgeball.
A Historical Leader Dips
Featuring data compiled by Felix Perrone
This weekend marks the first time GVSU has not been ranked #1 since day 1 of Nationals 2013.
We’ll present the story.
For the better part of 2013, GV was the top rated team, occasionally sharing it with SV and UK who held #1 for short bursts. GV had the longest top rating streak, but the top 5 were similarly ranked. Grand Valley was #1 heading into Nationals.
When JMU def GVSU 2-1 on the first day of Nationals 2013, it cost GV almost three whole rating points and pushed them out of #1 and set the top rated streak at 77 matches. In current terms, this upset ranks 49th, an 80th percentile upset. At the time it ranked as the sixth greatest upset on record.
As Nationals 2013 played out, #1 was claimed by UK, then SV, then UK again, as the teams played out their double strength matches in the tournament bracket. After defeating #1 UK in the semi finals, then #1 GVSU went on to claim the 2013 Championship against #2 MSU. The Gonzalez System has correctly predicted the winner of each Championship across the full records. At the time, the top tier of the rankings were a lot closer than it is today.
From this point on, GVSU would retain the #1 Gonzalez Rating in the League until this weekend’s games at the Gauntlet. 973 ranked matches were played by the rest of the League in that time.
That’s a full four straight seasons of being #1, (2014, ’15, ’16, ’17) plus the initial part of this season (2018) and up until this weekend’s games at the Gauntlet. During that top ranked team streak, GVSU won 131 and lost 10 in that period (.929 W%), and still kept #1 through their rare losses. We will also note that GVSU has claimed every National Championship title since climbing back to the #1 rating back at Nationals 2013. National Champions in 2013, ’14, ’15, ’16, ’17
Their email signature is getting quite long in listing all these titles. One question remains: will the dip continue to widen?
Who else has held the top rating?
Ok, so that’s another question. This weekend’s results mark the first time CMU was ahead of GVSU since Day 2 of Nationals 2012. GVSU def CMU 2-1 in the Elite 8 loss, which was also the last time CMU was ranked number 1, on April 15, 2012.
Just six teams have held the top rating since records began for the 2011 Season. This is mostly because of a sheer dominance by GVSU, but some older Member Teams were able to secure stretches before Grand Valley pulled ahead with that four season long top rated streak. But hey, at least everyone was tied for #1 at the start!
Of the 1300 ranked matches on record, these teams have held #1 for a total number of games:
GVSU – 1044 games
CMU – 156 games
SVSU – 50 games
WIU – 29 games
UK – 19 games
WKU – 2 games
Keep in mind, this isn’t necessarily a streak. The longest streak is GVSU’s 973 ranked matches, where they went 131 and 10 in the matches they played but still retained the top rating as the rest of the League went about playing.

A few mentions: each little dip represents the fractional reset each team rating experiences in the off season (regressing to the mean). The League average rating hovers around 40-41. Any team that is rated 50+ is a top level team, easily top 3.
In the graph, notice the first portion representing the first season (2011): As the Gonzalez system adapted itself, a couple teams maintained the top rating for short bursts. This was only 2-3 points above the initial starting rating of 40.000 that each team begins with. Most of this chunk happened in the fall of 2010 as the system established ratings for participating teams. This is a reason why the most accurate work relating to Gonzalez ratings starts with the 2012 Season, since we had 100 games played to sort out the adjustments at the beginning.
Now defunct Western Illinois held the top rating for 29 games after leading off the 2011 Season with a number of autumn games. They went 5 and 1 in that time, but only netted 42.600. WKU’s wins on the other side of the League allowed them to post a rating of just 42.602 after the 2010 Kentucky Dodgeball Cup, where they claimed the top rating for just two games. After the winter break, at the Kentucky Invite, WKU lost and gave up the top rating to SVSU who went undefeated there and posted 43.649.
After this, CMU really started to gain steam on the season after achieving their first top rated position at 2011 Chicago Dodgeball Open. That team was good, and they won a good bit of games that season, ran a 59 ranked match streak as the #1 team, then eventually took the Championship and ending the season with a 52.753.
At the end of Nationals 2011, we were seeing 50+ ratings which is more in line with a top rated team, as shown in later years.
Longest Streaks as the Top Rated Team
1) GVSU – 973 (Nationals 2013 to the Oct 2017 GV Gauntlet)
2) GVSU – 77 (Jan 2013 CDO to April’s Nationals 2013)
3) CMU – 59 (Feb 2011 MDC to April’s Nationals 2011)
4) CMU – 50 (April’s Nationals 2011 to Jan 2012 CDO)
5) CMU – 45 (Mar 2012 to April’s Nationals 2012)
What this list might not tell you is who knocked who off their streak, and Saginaw and UK had a few instances where they interrupted a streak (reference the graph). In fact, CMU’s 59 game streak was broken by SVSU def WKU in a Nationals bracket match, giving SVSU the top rating for just one match. CMU def OSU in the next game, which became a 50 game streak carrying into the January 2012 Chicago Dodgeball Open, in which GVSU took over for a shot bit.
More jostling was then had for GVSU, CMU, SVSU, and UK.
For the most part, until that incredibly long stretch by GV, the top 5 or so team ratings were fairly competitive as similar ratings. It was much easier for a team to break into the #1 spot. UK and SVSU were competitive and managed to post the top rating after key wins in those early seasons (read: a Nationals double strength win).
As for WKU, they’ll always have that cold December break of 2010 on which to remember their two game leader streak.
Disclaimer: At different points in time, we used different ranking systems that were not purely the Gonzalez System. Every Nationals has had quirks in the way it calculated team seeds going into Sunday. The seeds of Nationals 2011 did not match the corresponding seeds based on the current Gonzalez system ratings, because we didn’t use the Gonzalez system at the time. The thing that has stayed the same is the historical box score, and the resulting titles. This article is about the interpretation of the box scores through the current state of the Gonzalez system, adopted for exclusive use in Nationals 2017 (and has currently carried over to this point in the season. We can’t change past results. GVSU was top rated in the system for 80% of games played. They weren’t always ranked #1 in the various systems used over years.
Please keep in mind that there is a Exec Board vote scheduled on the NCDA Ranking Algorithm; so the Gonzalez system as it appears before you today may or may not be the single system we use for Nationals 2018 at VCU. We’ll release information on the vote as soon as it comes up.