With the first month of the season in the books we have already seen 50 games played through 9 events with 282 points being scored. It is still very early in the season but it is already looking like we are on pace to break several records this year, including some big ones like total number of games played and average points scored per game.
President Felix Perrone was bored one day so he ran some numbers and came up with some cool stats about the NCDA. While we have some incomplete stone age records going back to our first season in 2005, these stats use our complete records which date back to September 2010, up through this weekend.
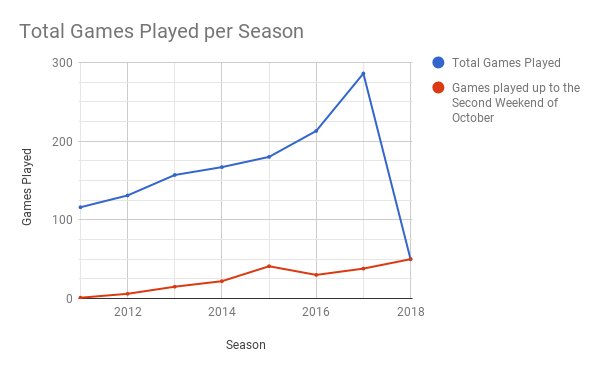
Here is a visual of the amount of games played over the last seven years, which includes this year which has only just begun (hence the drop). From 2011 to 2016, the number of unique teams has stayed relatively consistent around 22 on average, but there has been an increase in games played every single season.
I will give credit to Kent State for the first big increase that we saw in 2012. Though a majority of teams were active in 2011 and a 1 in 5 played 18+ games, Kent were the first ones to really put an effort in to play more games during the season. Kent played 22 going into Nationals 2012, playing six more at the event for a total 28 matches. They ended the season 22 and 6 (.786). The closest teams only played 20-21 matches in 2012. Part of the motivation was due to the NHL ranking system since it only rewarded teams who won games but did not punish teams for losing.
The last two years (2016 and 2017) have seen the biggest amount of increase in games played largely due to the explosion of new teams to the league. More teams means more games being played, and we can all thank Jacob Leski and the leaders of these new teams for the hard work they put in getting their teams off the ground. Only a month in, we are well on track to break 300 games this season.
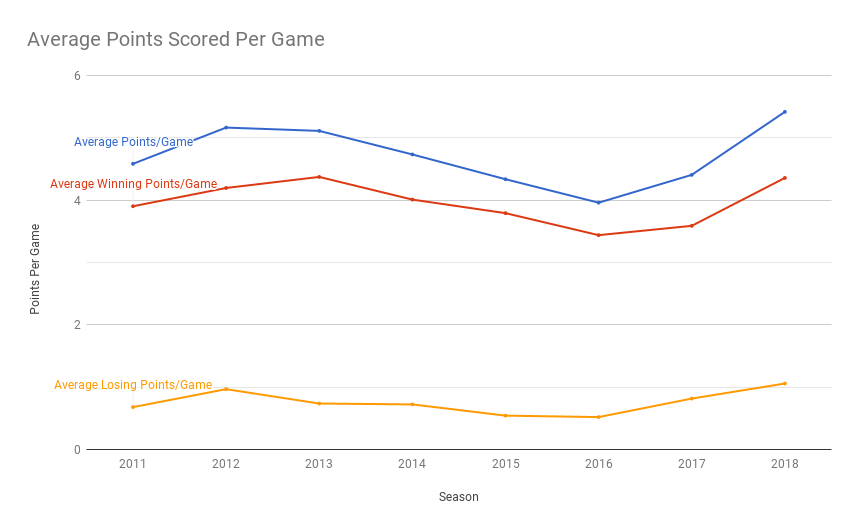
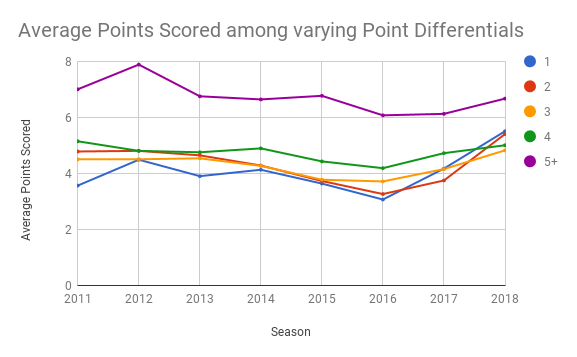
I believe these two graphs are very telling of the effect rule changes and prevailing strategy have had on the pace of play. The first graph shows the overall average number of points scored per match while the second breaks that down further by showing different lines for how close the final score of the match was (the point differential).
From 2013 – 2016 we can see that the points per game average steadily declined. During this time there were not any major rule changes and teams were often comfortable with gaining a one or two point lead and then sitting back, controlling the balls, and riding out their lead for the win. I believe JMU is the team that really pushed the league towards this ball control strategy when they demolished GVSU in pool play of Nationals 2013. JMU controlled the balls on the court and used their strong arms to pick off players one by one.
With the addition of the live blocking ball rule in 2016, we can see that there was a pretty large increase in the amount of points scored per match, presumably since it became harder to block and stay in the game. The differential graph shows that points per match increased in all different types of matches, from the blow outs to the overtime nail biters.
We will have to wait until we have more data to truly see how the new 12 v 12 rule will affect the game, but just from looking at these first 50 games it seems like we are going to be seeing a lot more points scored this season.
Top 5 Wins Against a Single Opponent
1) GVSU 34-4 MSU
2) GVSU 26-6 SVSU
3) GVSU 22-10 CMU
4) Towson 18-0 VCU
5) JMU 18-2 Towson
This stat should be titled the “never back down” stat (or maybe more accurately “didn’t you learn your lesson last time?”). I believe that there are three ingredients behind this stat; two teams that are geographically close, want to play a lot of games, and have a general skill level disparity between the two teams.
I think it is important to note that even though the GVSU – MSU stat line seems to look bad now, up until MSU got their first win over GVSU two years ago the stat used to be much much worse. The official records list a 22-0 record since 2011, but stone age records has the series at 37-0 before MSU got their first win. (ZM: Stone age records are carbon dated back to 2006, the start of GV’s team recordkeeping.) I sincerely hope the Towson – VCU series does not go that long before VCU grabs a victory.
Top 5 Number of Matchups against a Single Opponent
1) GVSU 34-4 MSU
2) GVSU 26-6 SVSU
3) GVSU 22-10 CMU
4) SVSU 15-10 MSU
5) SVSU 14-12 CMU
This is a very similar stat that is generated with two of the same aspects as the previous one; two teams that live close together and like to play dodgeball. In addition, for this particular stat, it helps for the teams to be closer together in skill range so they are more equally willing to travel and play each other.
Top 5 Team Win Percentages
| Team | W | L | W% |
|---|---|---|---|
| GVSU | 174 | 22 | .888 |
| JMU | 102 | 29 | .779 |
| CMU | 118 | 51 | .698 |
| SVSU | 104 | 56 | .650 |
| UK | 91 | 51 | .641 |
This one is highly dependent on the skill level of the particular team, but it also helps when several new teams join the League in their area, of if they are a strong team in a typically weak region.
Top 5 Team Wins
1) GVSU – 174
2) Kent – 134
3) CMU – 118
4) MSU – 111
5) SVSU – 104
(also teams with >100 wins)
Top 5 Total Games Played
1) Kent – 213
2) GVSU – 196
3) MSU – 193
4) CMU – 169
5) SVSU – 160
If you play a lot of games you have a better chance at winning a lot of games, and that’s a big reason why the same 5 teams are on both of these lists. Playing games builds experience, skill, and teamwork, which are very beneficial in generating wins in the proceeding games. If you want to start winning games you might need to put yourself out there and get a few losses first.
Top 5 Team Losses
1) DePaul – 95
2) BGSU – 94
3) MSU – 82
4) Kent – 79
5) WKU – 68
DePaul is forever #undefeated (for many different reasons) but they are currently the front runners in this category. The teams on this list play a lot of games, have a lot of fun, and get a lot of valuable experience. They have often times used this experience to build their programs into top tier teams.
The biggest lost that VCU had to Towson was 12-0; not 18-0. We were an inexperienced team but it was never that bad.
Also 18 straight losses to Towson… my goodness
Shadeed that is your team’s all time series record vs Towson, not a single game score line.
Dylan, I just realized that the moment I wrote my first comment. My apologizes on that. Great data and keep up the good work!
I’m a bit disappointed to see no mention of the most important statistic to this league, the Kevin Bailey Rating. It is alarming how league K.B.R. has dropped over these past few years. If you think this statistic is unimportant, you are plain wrong. Just look at GVSU’s current situation. Stop trying to hide these statistics from the people just so you can keep them as your sheep. Open your eyes people, Kevin Bailey is our dodgeball Christ, and it is time for a resurrection.