As the 2017-18 College Dodgeball season comes to a close, we have an opportunity to reflect on everything that happened during the year. One of the most intriguing questions in our sport right now is in regards to how regions stack up against one another. Some will argue the Michigan Region is clearly the best, but when looking at the Power Rankings produced throughout the season, it is a closer race than some may assume.
This season, we produced a Monthly Power Rankings following each month that teams were active, starting with a Preseason list, leading all the way up to April 2018. While the Post-Nationals Power Rankings is yet to be determined, there is plenty of data to analyze from the other lists.
Before we dig in, the first question that needs to be answered is: what are the NCDA’s regions? To be clear, the league does not have set “regions” or “conferences” just yet, but for content/organizational purposes we assign each team to a certain region. Here are the 6 regions I used for this analysis:
- Michigan
- East Coast
- Ohio
- The South (includes Kentucky schools)
- Midway (formerly known as the Illinois Region)
- Pacific Northwest
Below is a breakdown of College Dodgeball’s Regional Hierarchy throughout the 2017-18 season:
For this analysis, I chose to use two separate methods to explore the strength of each region. Both methods were based on the monthly power rankings (which ranked teams 1-20).
Method 1:
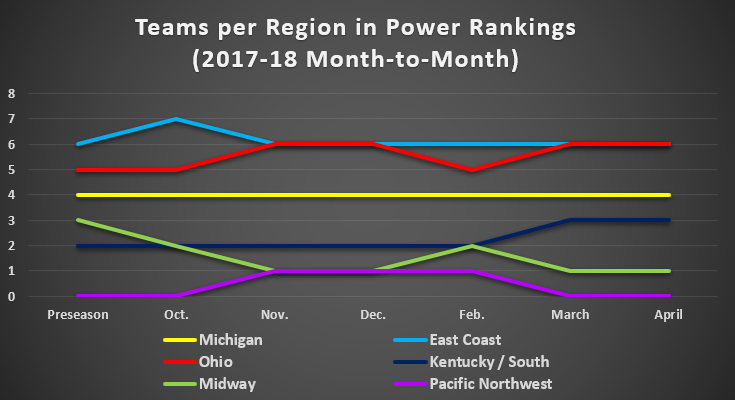
Simply award regions 1 point for each team they have within the top 20 Power Rankings. That’s it. While this method was easy to use, and provided some interesting results, there were clearly some issues. Having each spot in the top 20 being worth the same is not an accurate way to tell which region really is the best. Obviously, having 3 teams in the top 5 is more valuable than having 3 teams sneak into the rankings within the bottom 5 positions.
Method 2:
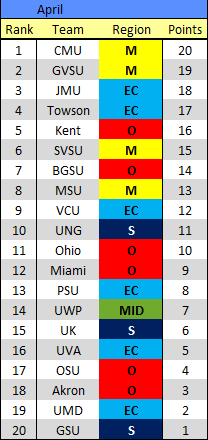
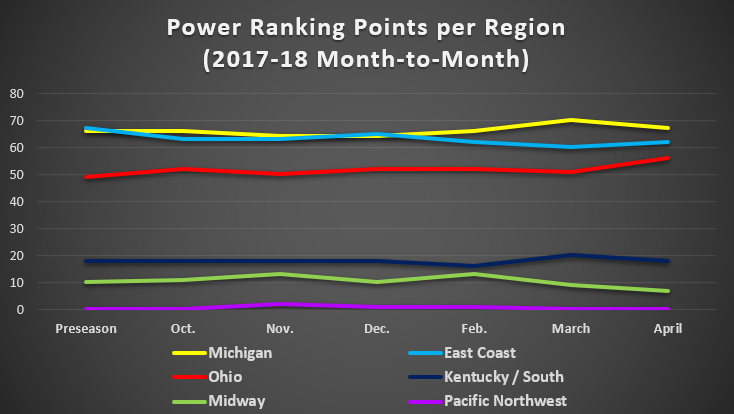
Each Power Ranking orders the top 20 teams in the country. I assigned a point value for each position in the top 20. Being ranked #1 was worth 20 points, #2 was worth 19, all the way down to #20, which was worth 1 point. From there, I added the point values of each team in a certain region to find the total points earned by that region as a whole. Clearly this method will provide more accurate results.
For reference, here is an example of the Method 2 point system using the April 2018 Power Rankings:
I took the Power Rankings results from each month, and used both of these methods to track how each region performed over the course of the 2017-18 season. Before we get to the graphs, the results for each method are in the tables below:
Method 1:
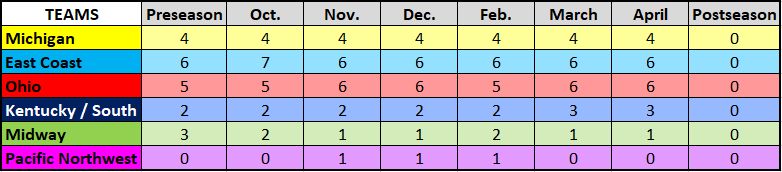
Method 2:

*Note, there was no PR list for January because it was during winter break when teams were not active.
Now, let’s take a look at what all these numbers mean. Here are graphs for both methods:
Method 1:
Method 2:
After taking a look at these findings, which region do you think is the best? Do you predict any major changes after Nationals? How about during the 2018-19 season? Comment below with your thoughts!