So the initial thought for someone reading this is probably, “what in the world is ‘Scorigami'”, or at least something along those lines. The quick breakdown is that Scorigami looks at all the historical scores over time within any league and sees how frequently each result has happened. It was an idea created by Jon Bois to implement with NFL scores. In his case, he wanted to see which results have never happened before in the history of the NFL, in the hopes that teams eventually achieve every possible score to complete his chart. For a full breakdown I recommend checking out his video on it here, and if you want to see what the NFL’s current Scorigami looks like check that out here.
Admittedly, a full Scorigami chart looks a lot cooler for American Football given how many different ways there are to score and with varying point values as compared to dodgeball. Hopefully someone finds it entertaining though. Aside from a pretty picture, we can use it to get a better understanding of the history of our league and see how scoring has changed over time.
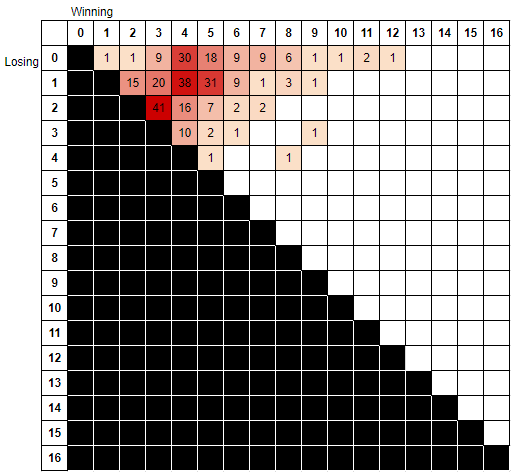
All-Time Scorigami Chart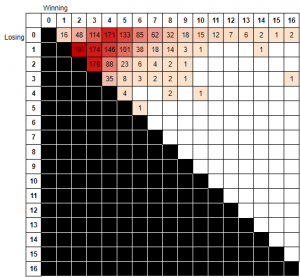
Over the course of the entire NCDA’s history (or at least the history of all available scores) we can see the heaviest concentration of final scores in the 2-1 area, then slowly fanning outward from there. There are some really wild scores which I will point out later on, but for now I want to focus on a year by year look to illustrate how the league has changed.
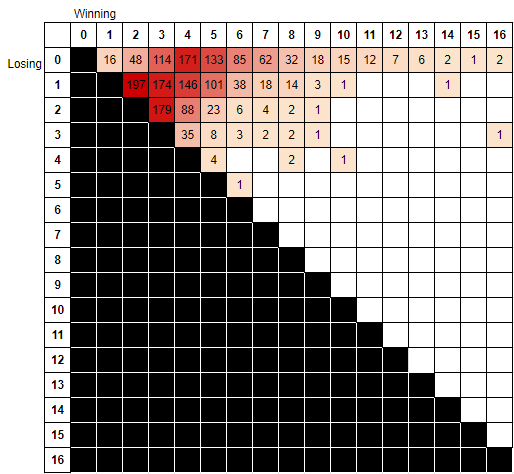
Beginning of the Gonzalez Era

During the 2010-11 season, the NCDA saw the introduction of the Gonzalez ranking system which is derived from Elo Ratings. The goal of this was to create an unbiased power-ranking system to evaluate each team’s likelihood to win against the average. It also marks what many could consider to be the beginning of the “modern era” of the NCDA. Looking at the Scorigami chart, it’s fairly easy to see the most common score line of 2-1, most of which came at Nationals 2011 as a result of the Gonzalez System which would pit opponents of similar skill against each other more often in late rounds.
(Edit; the Gonzalez system was introduced for bracket seeding at Nationals 2014, while the 2011 Season was just the first Season to be completely and accurately recorded. Nationals 2011, 2012, 2013 had a variety of seeding mechanisms. -zm)
There also were still a significant amount of blowouts as well. Approximately 32% of matches ended with one team winning by at least a five-point spread, which is the highest during a full season on record.
The Year to End “Dirty” Blocking
In the not so distant past, there was a time when any ball-on-ball contact resulted in a dead ball. This contributed to what was known as the “dirty” block where a player would only need to make the smallest contact with their blocking ball at an atomic level to prevent themselves from getting out. Without question this made it harder to get players out and as a result made points more grueling to win. The final year the rule was written in that form was the 2015-16 season, and the corresponding Scorigami for that season is below.
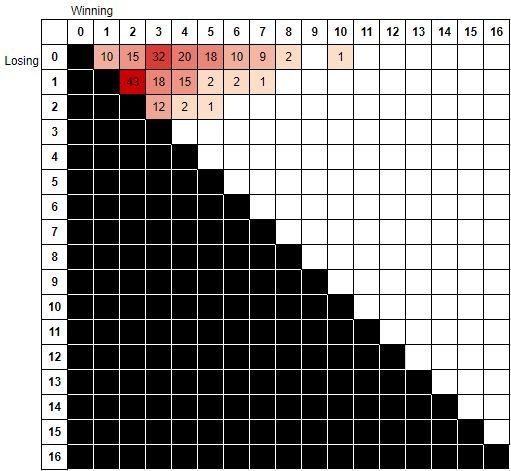
There were a lot of lows that season in terms of scoring. It was the only year in recorded NCDA history where there was an average of less than 4 points scored per game, with corresponding record lows for both winning and losing sides. Another way to look at it is the number of 1-0 results. In the entire NCDA history there have been 16 matches that have ended 1-0, 10 of which came in this one season alone. The most notable of those came in the last game of the year when GVSU defeated CMU 1-0 for the national championship.
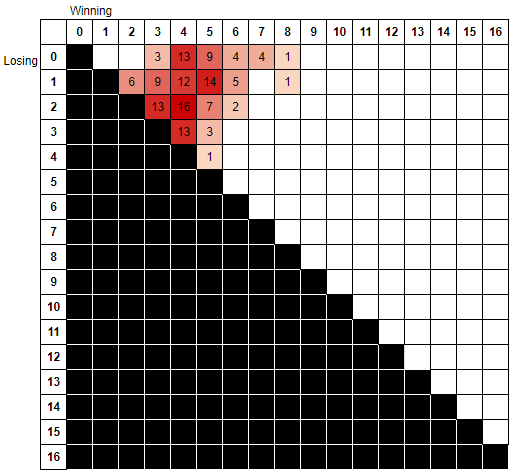
Rule Changes Are Effective
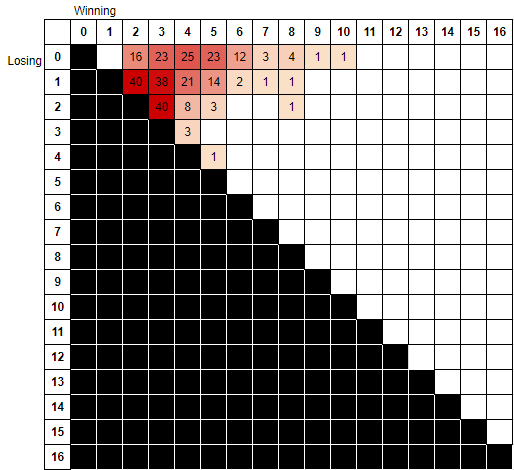
After the 2015-16 season, the league finally voted to change blocking rules, and as the chart above shows, there’s clear evidence about its impact on overall scores. For one, there were zero games that ended 1-0 which was a big improvement on the year before. Additionally, during the 2015-16 season only 53% of games resulted in 4 or more points scored compared to the 2016-17 season when that number jumped up to 70%.
Another interesting takeaway from that season was how competitive the season was as a whole. It was the only season on record where the average margin of victory was less than 3 points, and there was also the second most upsets under the current Gonzalez System.
One season later, another big rule change was enacted that changed the NCDA, 12 v 12 player games. The move from 15 players per side to 12 was certainly met with either a lot of support or scrutiny, but there’s no denying it has led to an increase in scoring output. In regards to that same 4 points or more stat I mentioned earlier, during the 2017-18 season that figure jumped up to roughly 86% of matches.
Where We Are Now
So far through the 2018-19 season we are continuing to see that upward push in scoring. To highlight this, every single game resulted in at least 3 points scored between both sides which would be a first all time if the trend continues. Additionally, we are averaging roughly 5.5 points scored per game between both teams, which is an all-time high for the league.
Notable Scorigami Results
The one that probably sticks out the most is that 16-3 score which is the highest scoring game in the NCDA’s modern era (and probably ever will be under the league’s current rules). On February 18th, 2006, THE Ohio State University defeated the University of Kentucky in unprecedented fashion, and also capped off that season with a national title. What is crazy to think about with that match is 19 points scored in 50 minutes, which comes out one point being scored every 2 minutes and 38 seconds.
One that I found particularly interesting was the lone 6-5 score in our Scorigami table. The main thing I find interesting about it is that it’s the only time in league history a team has lost while scoring at least 5 points. This was achieved when James Madison University defeated the University of Maryland on November 13th, 2011.
Another Scorigami on the far out end came in the form of a 10-4 victory for DePaul on January 15th, 2012. At the Chicago Dodgeball Open, DePaul defeated the University of Nebraska for their most points scored in program history, and is also the second most points in a game where both teams scored at least twice (first place being the aforementioned 16-3 game).